Master Real Estate Investment Analysis for Smarter Deals

Real estate investment analysis is how you look under the hood of a property to see if it’s a lemon or a winner. It’s not about getting a “good feeling” about a place; it’s a disciplined, data-driven approach to figuring out what a property will actually earn, what could go wrong, and whether it’s the right move for your money.
Think of it as the financial equivalent of a home inspection. You wouldn't buy a house without checking the foundation, so why would you buy an investment without checking its financial bedrock?
Why Real Estate Investment Analysis Is Your Safety Net

Jumping into a property deal without doing the numbers is like trying to cross the ocean in a rowboat without a compass. You might get lucky and hit land, but chances are you’ll just end up lost. Real estate investment analysis is that compass. It turns a blind gamble into a calculated risk, giving you a clear map to follow.
This is what separates the pros from the speculators. It’s the framework that helps you see past a beautiful kitchen or a great view and focus on the cold, hard numbers that will ultimately determine your success or failure.
To really understand a property's potential, you need to break down the analysis into its core parts. Each piece of the puzzle gives you a different view of the investment's health.
Core Components of Real Estate Investment Analysis
| Analysis Component | Primary Goal | Example Question It Answers |
|---|---|---|
| Market Analysis | To understand the economic environment the property exists in. | Is this neighborhood growing, or are people leaving? |
| Income Analysis | To calculate all potential revenue the property can generate. | How much rent can I realistically charge, and will the units stay full? |
| Expense Analysis | To identify and project all costs associated with owning the property. | What will I really pay for taxes, insurance, and surprise repairs? |
| Financial Metrics | To distill complex data into simple, comparable performance indicators. | What is my annual return on the cash I'm putting in? |
| Risk Assessment | To uncover potential threats to profitability and cash flow. | What happens to my investment if interest rates go up or a major employer leaves town? |
Putting these components together is what gives you a complete, 360-degree view, turning a property listing into a transparent investment opportunity.
From Guesswork to Confident Decisions
A proper analysis forces you to answer the tough questions with facts, not feelings. It helps you get past the superficial sales pitch and dig into a property's true financial story.
This structured approach lets you:
- Forecast Potential Returns: You can confidently project rental income and, more importantly, figure out what you'll actually pocket after every bill is paid.
- Identify Hidden Risks: Good analysis uncovers the money pits—like a history of high tenant turnover or underestimated maintenance—before they drain your bank account.
- Compare Properties Objectively: It gives you an apples-to-apples way to line up multiple deals and see which one truly offers the best financial upside.
- Secure Better Financing: Lenders love a borrower who comes prepared. A detailed analysis proves you've done your homework, making them far more likely to trust you with their money.
Adapting to a Shifting Market
The real estate market is always in motion. We've all seen how quickly economic changes, from interest rate hikes to inflation, can shake things up. Over the past year, for instance, higher debt costs definitely put a damper on investment activity in many areas. Yet, even as property values felt the pressure, sectors like industrial and multifamily rentals showed impressive resilience, with rents continuing to climb. You can get a better sense of these trends by exploring a global real estate outlook.
This is where your analytical skills become your superpower. A solid grasp of the numbers allows you to navigate market volatility, sidestep the pitfalls, and spot the resilient opportunities others might miss.
Key Takeaway: Real estate investment analysis isn’t just some academic exercise. It's a practical safety net that shifts you from being a passive buyer to a strategic investor, ready to make smart decisions in any market.
Let's be honest, pulling together all the data for this—from MLS listings to tax records and market comps—is a huge time sink. To streamline your research, you can use modern tools to do the heavy lifting. For example, you can download our chrome extension to pull property data directly from websites into a spreadsheet, saving you hours of tedious copy-and-paste work.
Decoding the Numbers That Actually Matter
When you start digging into a potential investment property, you're going to get hit with a tidal wave of financial terms and formulas. It's easy to get lost in the jargon. But here’s the secret: successful real estate investment analysis isn't about passing a math test. It's about learning to read the vital signs of a property's financial health.
Think of these core metrics as your toolkit. They help you cut through the marketing fluff and make sharp, objective decisions. Most importantly, they give you a standard way to compare a duplex in one neighborhood with a small apartment building across town, helping you spot the deals that truly have legs.
Net Operating Income (NOI): The Property's True Profit
Before you can talk about returns, you have to get to the heart of a property's profitability: the Net Operating Income (NOI). This is arguably the single most important number to nail down because it tells you how much money the property itself generates, long before your personal loan comes into the picture.
It’s a simple concept. NOI is just all the money a property brings in, minus all the costs of keeping it running.
- Income: This is the total rent you collect, plus any extra cash from things like parking fees, coin-op laundry, or storage units.
- Operating Expenses: These are the non-negotiable costs of owning the place. Think property taxes, insurance, routine maintenance, property management fees, and utilities.
What’s crucial here is what's left out. NOI purposefully ignores your mortgage payments, major one-off capital expenses (like putting on a new roof), and your personal income taxes. It’s the pure, unadulterated profit the asset produces on its own.
A critical first step is getting your income projections right. Learning how to calculate rental income like a pro is essential for ensuring the rest of your analysis is built on a solid foundation.
Capitalization Rate (Cap Rate): A Quick Measure of Risk and Return
Once you know the NOI, you can quickly calculate the Capitalization Rate, or Cap Rate. I like to think of the Cap Rate as a property's "financial horsepower"—it’s a fantastic shorthand for comparing the potential return of one deal against another.
The formula is pretty straightforward:
Cap Rate = Net Operating Income (NOI) / Current Market Value (or Purchase Price)
Generally, a higher Cap Rate signals a higher potential return, but it often comes with more risk. A lower Cap Rate usually points to a safer, more stable property in a prime location. There's no magic "good" Cap Rate; it's all about context and what's normal for that specific market and property type.
For example, a 7% Cap Rate tells you that for every $100,000 of the property's price, you can expect $7,000 in net income each year. It creates a level playing field, giving you an apples-to-apples way to see if a property is priced fairly for the income it generates.
Cash-on-Cash Return: Your Personal ROI
While the Cap Rate tells a story about the property, the Cash-on-Cash Return tells a story about your money. This metric is incredibly practical because it measures the return on the actual cash you pulled out of your pocket to make the deal happen.
It answers the one question every investor cares about: "For every dollar I put in, how many cents am I getting back each year?"
Here’s how you figure it out:
- Find Your Annual Pre-Tax Cash Flow: This is simply your NOI minus your total annual mortgage payments.
- Tally Your Total Cash Invested: Add up your down payment, all your closing costs, and any money you spent on initial repairs or upgrades.
- Do the Math: (Annual Pre-Tax Cash Flow / Total Cash Invested) = Cash-on-Cash Return.
Let's say your annual cash flow comes out to $6,000, and you put in a total of $50,000 to buy and fix up the place. Your Cash-on-Cash Return would be a very healthy 12%. This number is so powerful because it shows you exactly how hard your invested capital is working for you.
Pulling together all the data for these calculations—from listing prices and rental comps to tax records—can be a real grind. To speed things up, you can download our chrome extension to extract property data directly from websites, helping you populate your analysis spreadsheets in minutes, not hours. If you want to get even more advanced, our guide on web scraping for real estate shows you how to automate this process and build powerful datasets from scratch.
Your Step-by-Step Property Analysis Blueprint
Now that we’ve broken down the key metrics, it's time to put them together into a practical, repeatable workflow. A solid real estate investment analysis isn't just a jumble of numbers; it's a structured blueprint that guides you from finding a property to making a confident "go" or "no-go" decision. By following a consistent method, you ensure you don't overlook crucial details and can compare different deals apples-to-apples.
Think of this blueprint as your road map. It moves you logically from a high-level look at the market down to the nitty-gritty details of a specific property's cash flow. Each step builds on the one before it, painting a complete financial picture of your potential investment.
Phase 1: Sourcing Reliable Market and Property Data
Your analysis is only as strong as the data you start with. The first, and arguably most important, step is to gather accurate information on both the market and the specific property you’re eyeing. This is more than just glancing at the listing sheet; it requires some real detective work to verify the numbers and truly understand the local landscape.
Here’s the essential data you need to hunt down:
- Property Details: Start with the basics—purchase price, square footage, number of units, and the building's age.
- Comparable Sales ("Comps"): Your goal is to find at least three similar properties nearby that have sold in the last six months. This is how you confirm if the asking price is realistic.
- Rental Market Data: Find out what similar units are actually renting for right now. Don't take the seller's rent roll at face value. Check it against active listings on sites like Zumper or Rentometer.
- Property Tax Records: Head to the local county assessor’s website to look up the official tax history. This is public record and the only way to get the true tax figure.
Phase 2: Estimating Income and Expenses
With your raw data collected, it's time to build a realistic financial forecast. This is where so many new investors stumble—they get starry-eyed about potential income or completely underestimate the real costs of owning a property. Getting this part right is absolutely critical.
First, calculate the Potential Gross Income (PGI). This is the absolute maximum rent you could collect if the property was 100% occupied, 365 days a year. But we all know that's not how the real world works.
Key Insight: Never, ever assume 100% occupancy. A conservative vacancy rate—usually 5-10% of PGI, depending on your market—is an essential buffer that accounts for the inevitable downtime between tenants.
Next, you have to list out every single operating expense. Be meticulous.
- Property Taxes
- Insurance
- Utilities (for any services not paid directly by tenants)
- Routine Maintenance and Repairs (a good rule of thumb is to budget at least 5-10% of PGI)
- Property Management Fees (even if you plan to manage it yourself, you should still account for this cost)
- Landscaping and Snow Removal
- Pest Control
Subtracting your total operating expenses (including that vacancy allowance) from your PGI gives you the Net Operating Income (NOI)—the property's pure, unlevered profit. To make sure you've covered all your bases when building this out, a good expert due diligence checklist template is an invaluable tool.
Phase 3: Stress-Testing Your Investment
A good analysis projects the likely outcome. A great analysis prepares you for the unexpected. This is where sensitivity analysis, or "stress testing," comes in. It helps you see how your deal would hold up if key assumptions change. What happens if interest rates spike? Or if a major repair bill lands in your lap in year two?
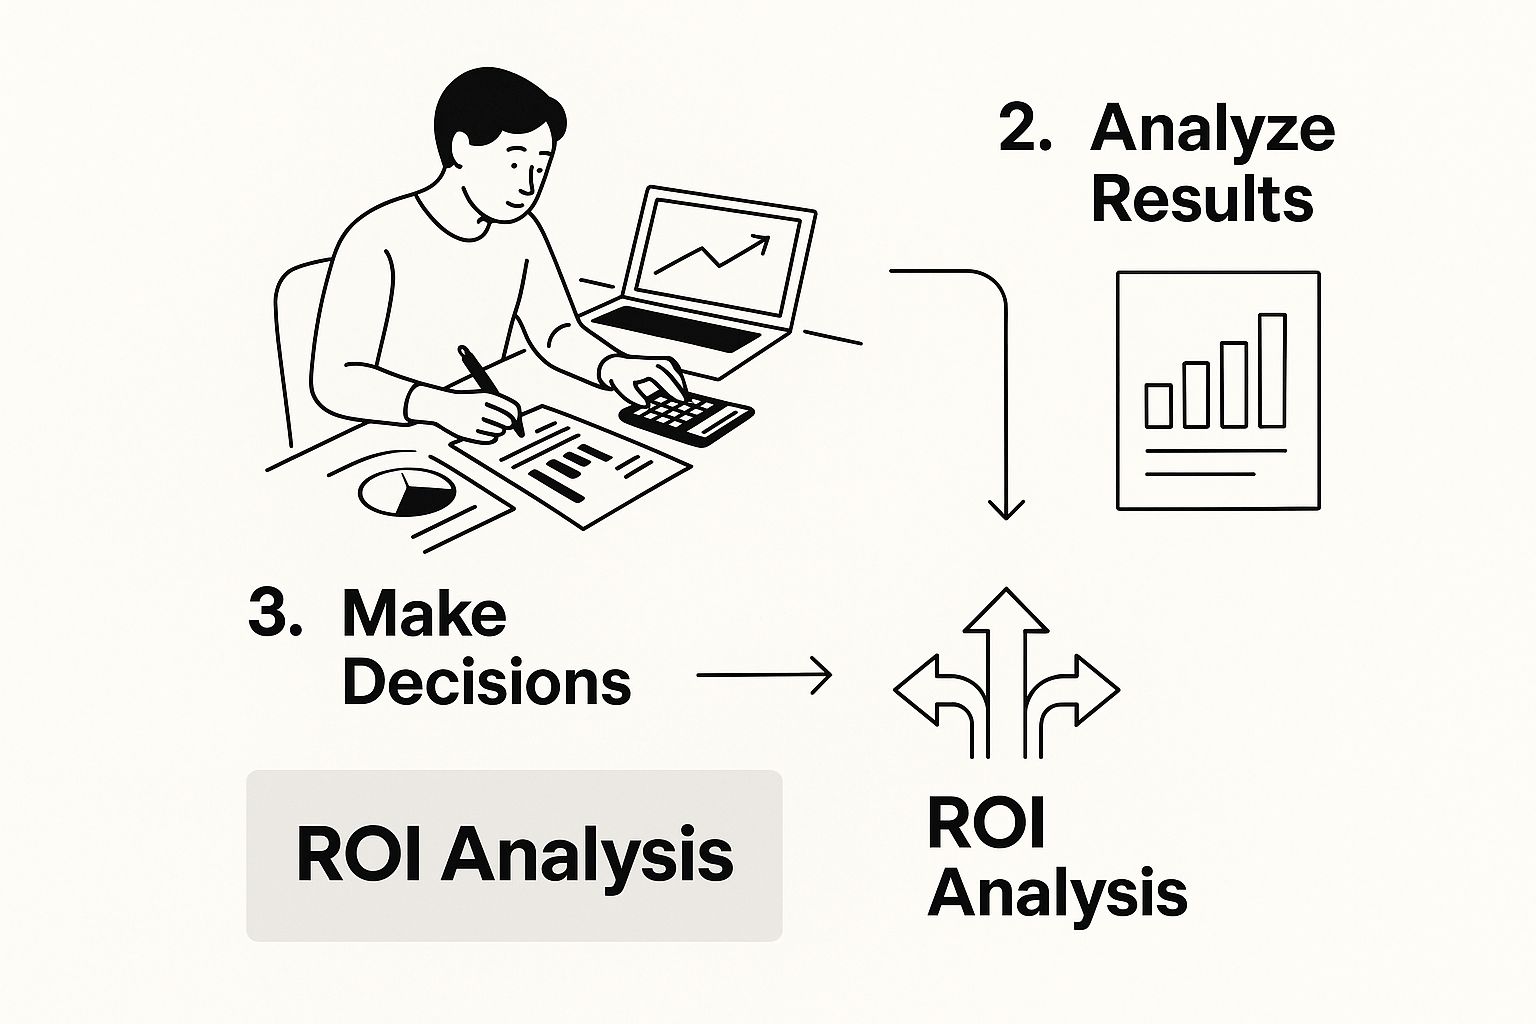
The image above perfectly captures someone doing this kind of deep dive, pulling together all the data points to see the full picture. It shows why you have to move beyond a single calculation to a dynamic model that accounts for risk.
You should run scenarios for a few common variables:
- Increased Vacancy: Model a worst-case situation. What if vacancy jumps to 15% or even 20%? Does the property still cash flow, or are you in the red?
- Higher Interest Rates: If you're financing the deal, see what a 1% or 2% jump in your mortgage rate does to your cash-on-cash return. The difference can be shocking.
- Unexpected Capital Expenses: Project what happens if you have to replace a big-ticket item, like the roof or an HVAC system, within the first five years.
By stress-testing your numbers, you're building a more resilient investment that can handle the inevitable bumps in the road.
Finding Opportunity in Emerging Real-Estate Trends

A truly effective real estate investment analysis goes way beyond sizing up the duplex down the street. While traditional residential and commercial properties are the bedrock of many portfolios, the most exciting returns are often found by looking ahead. The savviest investors are the ones digging into niches poised for explosive growth, driven by big shifts in technology and how we live.
Instead of just looking at where the market is, forward-thinking analysis asks where the market is going. This means getting a handle on the powerful forces creating demand for specialized properties and knowing how to evaluate them. It’s about building a future-proof portfolio that doesn't just ride the current waves but actually anticipates the next ones.
The Rise of Specialized Real Estate Assets
Right now, two sectors drawing a ton of investor attention are data centers and self-storage facilities. They might seem worlds apart, but they’re both fueled by powerful, long-term trends. To really understand them, you need a more specialized analytical lens.
- Data Centers: Think of these as the physical brains of our digital world. The relentless demand for cloud computing, streaming, and AI has turned these secure, power-hungry buildings into a premier real estate asset class.
- Self-Storage Facilities: People are always going through life changes—downsizing, moving, or even starting e-commerce businesses that need inventory space. Self-storage taps into that constant need with a surprisingly resilient and straightforward business model.
A huge part of the appeal is the potential for high yields. Recent analysis of global real estate trends points to data centers as a top prospect, a direct result of the AI and data boom. In fact, they now rank as the number one prospect for investment across the Americas, Europe, and Asia-Pacific. That’s a powerful testament to just how much we depend on our digital infrastructure.
How to Analyze Data Center Investments
Analyzing a data center is a whole different ballgame than sizing up an apartment building. These are high-tech assets, and your real estate investment analysis needs to account for some very unique variables.
Your financial model has to get granular on:
- Massive Upfront Costs: It’s not just the building. The investment in industrial-grade cooling systems, redundant power supplies, and top-tier security is enormous.
- Specialized Operational Expenses: These facilities consume staggering amounts of electricity. Your projections for utility costs have to be spot-on, and they can fluctuate wildly.
- Tenant Creditworthiness: Your tenants are often giant tech corporations. The stability and credit rating of companies like Amazon Web Services or Microsoft Azure are central to the investment's risk profile.
- Technological Obsolescence: Tech moves fast. You must factor in the risk that the facility’s hardware could become outdated, requiring expensive and disruptive upgrades down the road.
A data center's value isn't just in its square footage; it's in its power capacity, connectivity, and security. Your analysis must reflect these technical specifications as core drivers of revenue and risk.
Evaluating Self-Storage Opportunities
On the other hand, self-storage offers a simpler, more accessible entry point into niche real estate. Here, the analysis is all about location, operational efficiency, and local market dynamics. This asset class is often praised for its low overhead and tough-as-nails demand.
Key things to analyze include:
- Hyper-Local Demand: Success is often decided within a 3- to 5-mile radius. Is the local population growing? Are there a lot of apartment dwellers who need extra space?
- Unit Mix and Pricing: Your analysis should project the best mix of unit sizes (5x5, 10x10, 10x20) and a pricing strategy for each. This is what drives your total revenue.
- Break-Even Occupancy: Figure out the occupancy rate you need to cover all your expenses. Self-storage facilities can often break even at much lower rates (60-70%) than other commercial properties.
To uncover these kinds of opportunities, you need to look beyond the usual listing sites. If you’re trying to pull specific details from niche real estate platforms, you can learn more about how to scrape real estate listings to automate your research.
Finding these unique deals takes more than just running the numbers—it requires a curious and forward-looking mindset. When you can connect broad economic trends to specific properties, you unlock a whole new level of investment strategy.
Common Analysis Mistakes and How to Avoid Them
Even the sharpest investors can see a great-looking deal unravel if their analysis is built on shaky ground. The smartest way to protect your capital is to learn from the mistakes others have made. It’s not about being pessimistic; it’s about being realistic and building a financial model that can withstand a few surprises.
Let's walk through some of the most common traps and, more importantly, how you can sidestep them to keep your investments on track.
Overly Optimistic Occupancy and Rent Projections
It’s easy to look at a property's current rent roll and think, "I can do that, maybe even better!" That's a classic rookie mistake. The reality is, you'll almost never have 100% occupancy 100% of the time. Tenants move out, and it takes time to clean, market, and fill a unit.
A solid analysis always accounts for this. A good starting point is to factor in a vacancy rate of 5-10% of the property’s total potential rent. This number can shift based on your local market and the building's condition, so do your homework.
Example: Imagine you buy a 10-unit building where rents are $1,500 per month. You might project $180,000 in annual income and base all your numbers on that. But if just one of those units stays empty for the year, you've just lost $18,000. That single oversight can completely wreck your cash flow.
Underestimating Capital Expenditures (CapEx)
Fixing a leaky faucet is a maintenance expense. Replacing the entire roof is a Capital Expenditure (CapEx). These are the big, expensive, and unavoidable costs that pop up every few years—things like a new HVAC system, repaving a parking lot, or replacing all the windows.
Forgetting to budget for CapEx is one of the fastest ways to turn a profitable property into a money pit. You need a separate savings fund just for these items. A safe rule of thumb is to set aside at least 5% of your gross rental income for future CapEx. Think of it as a safety net for when—not if—a major system gives out.
Forgetting the True Cost of Management
Another blind spot for many investors is underestimating the cost of management, especially if they plan to do it themselves. Your time isn't free. Even if you aren't paying a property manager, you should still factor that cost into your analysis. The industry standard is typically 8-10% of the rent you actually collect.
Why do this? Two critical reasons:
- It gives you a true picture of profitability. This shows you what the property really earns after accounting for the labor required to run it.
- It creates a built-in contingency. If you ever get tired of late-night phone calls and decide to hire a professional, the expense is already accounted for. The deal will still work.
Pulling together all the data needed to avoid these mistakes can be a grind. Using effective data extraction software can help automate the tedious work of gathering market data and property comps, freeing you up to focus on what really matters: an accurate forecast. To grab property details directly from websites quickly, you can download our chrome extension. This ensures your analysis is built on a foundation of solid facts, not just hopeful guesses.
Your Real Estate Investment Analysis Questions, Answered
Alright, so you've learned the methods and the metrics. But when you start looking at actual deals, a whole new set of practical questions always pops up. It's one thing to understand the theory; it's another to apply it with your own money on the line.
This section is here to tackle some of the most common questions I hear from investors who are just starting out. Think of it as a quick chat to clear up any lingering confusion and help you move forward with confidence.
How Much Math Do I Really Need for This?
This is probably the number one question I get, and the answer almost always surprises people: you don't need to be a math genius. The calculations are just basic arithmetic—addition, subtraction, multiplication, and division. What’s far more important is understanding the story the numbers are telling you.
For example, knowing that Net Operating Income (NOI) is what’s left to pay the mortgage and put in your pocket is more valuable than being able to do complex algebra in your head. And besides, we have spreadsheets and specialized software to do the heavy lifting for us.
Your real job is to focus on the concepts:
- What does a high cash-on-cash return actually mean for this specific neighborhood?
- Why is the cap rate so critical for quickly comparing one property to another?
- How does underestimating repairs by just $1,000 a year totally wreck your long-term returns?
It's less of a math test and more like being a financial detective, piecing together clues to see if a property is a winner.
What Are the Best Free Data Sources for My Analysis?
Your analysis is only as good as your data. Garbage in, garbage out. The good news is, you can get fantastic data for free if you know where to look.
For property listings and finding comparable sales (or "comps"), websites like Zillow, Redfin, and Realtor.com are your go-to starting points. When you need to figure out what you can realistically charge for rent, platforms like Zumper and Rentometer give you solid benchmarks.
Here's a pro tip I always share: never trust a single source. Always cross-reference your numbers. If the seller’s listing says property taxes are $3,500, take two minutes to verify that on your local county assessor's website. It’s a simple step that can save you from a major headache.
To speed all of this up, a web scraping tool is a complete game-changer. Instead of manually copying and pasting details from dozens of tabs, you can automate it. For instance, you can download our Chrome extension to pull listing details from multiple pages right into a spreadsheet. It saves an incredible amount of time.
How Does a "Good" Cap Rate Change Between Markets?
This is a classic rookie mistake—thinking there's a single "good" cap rate. In reality, a good cap rate is all about context. It’s a direct reflection of risk and reward in a specific market.
In a stable, high-demand city like Boston or San Francisco, you'll see low cap rates, often in the 3-5% range. Why? Because investors are willing to accept a smaller immediate cash flow in exchange for lower risk and the high probability of long-term appreciation.
But head to a smaller, up-and-coming market in the Midwest, and you might see cap rates of 8-10% or even higher. Investors there demand a better return to compensate them for taking on more risk in a market with less predictable growth.
The same logic applies to different types of properties. A boring (in a good way!) multi-family apartment building with stable tenants will almost always have a lower cap rate than a hotel, which has to deal with seasonality and economic swings.
The only way to know if you've found a good deal is to compare your property's cap rate to the average for similar properties in that exact neighborhood. That local benchmark is your truth-teller.
At PandaExtract, we build tools to make gathering complex data simple. If you want to quickly pull property data, rental comps, and other critical info for your analysis without writing a single line of code, give our tool a try. You can download our Chrome extension and start building smarter, more accurate investment models today.
Published on